

Introduction
Web responsiveness is the measure of how quickly a website responds to user interactions, and it is crucial for providing a smooth and efficient user experience to your users.
Here are examples of poor responsiveness and good responsiveness.

In this blog post about web responsiveness and the metric Interaction to Next Paint (INP), we will cover:
- How slow interactions are measured and reported to Google
- How to find and debug slow interactions
- How to avoid common mistakes that lead to slow interactions
What’s Interaction to Next Paint (INP)
Interaction to Next Paint (INP) is a new Core Web Vital which measures the elapsed time from when a user interacts with a web page (e.g., clicks, taps, or presses a key) to the moment the browser is able to paint the next frame.
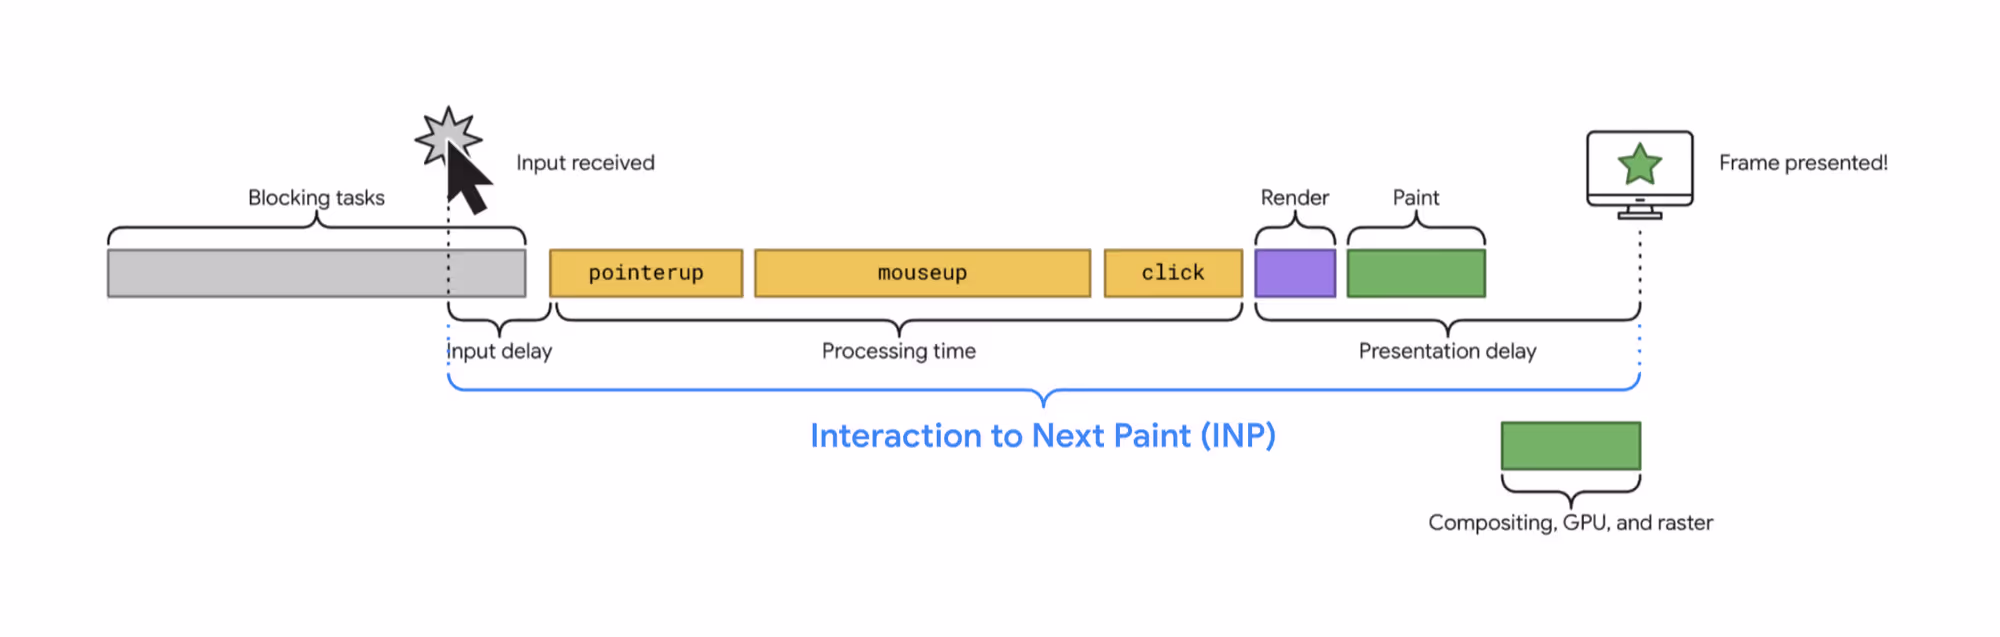
INP is the sum of three sub-parts:
- Input Delay: the time spent to finish processing the tasks that were already in the queue at the moment of the interaction
- Processing Time: the time spent processing the event handlers attached to the element which the user interacted with
- Presentation Delay: the time spent figuring out the new layout, if changed, and painting the new pixels on the screen
As every other Core Web Vital, the value of Interaction to Next Paint is reported to Google from the Google Chrome browser, while real users are interacting with your web pages.
Debugging slow interactions
Identifying and debugging slow interactions is crucial for improving your website's INP.
The two major steps are:
- Find out where the slowest interactions are occurring
- Analyze the causes of those slow interactions
1. Find out where the slowest interactions are occurring
The process of finding slow interactions changes depending on whether or not you have Real User Monitoring (RUM) data with INP attribution.
RUM data provides real-world insights into how users experience your website, offering detailed information about their interactions. It’s like having a constant, real-time survey of what users experience. This allows you to verify the fixes you applied just minutes after their deployment.
INP attribution data provides contextual information for a specific interaction: the element selector that was targeted, the event type that triggered it, and more. Ideally, you should collect INP attribution data in RUM to more easily pinpoint specific slow interactions and their causes.
How to find slow interactions without RUM data
If you don’t have RUM data available, you’ll have to manually debug interactions on different page types to find the slowest ones. This process can be tedious and time-consuming.
To find the slowest interaction without RUM data, you need to:
- Download and add the Web Vitals extension from the Chrome Web Store.
- Go to the extension options, enable Console logging, hit “Save”.
- Open Chrome’s Developer Tools
- Emulate mobile device: Use your browser's developer tools to emulate mobile devices, which often experience slower interactions due to less powerful hardware.
- Slow down CPU speed: Throttle the CPU in the performance panel to simulate lower-end devices. This is because your computer is likely much faster than the average mobile device being used on your website.
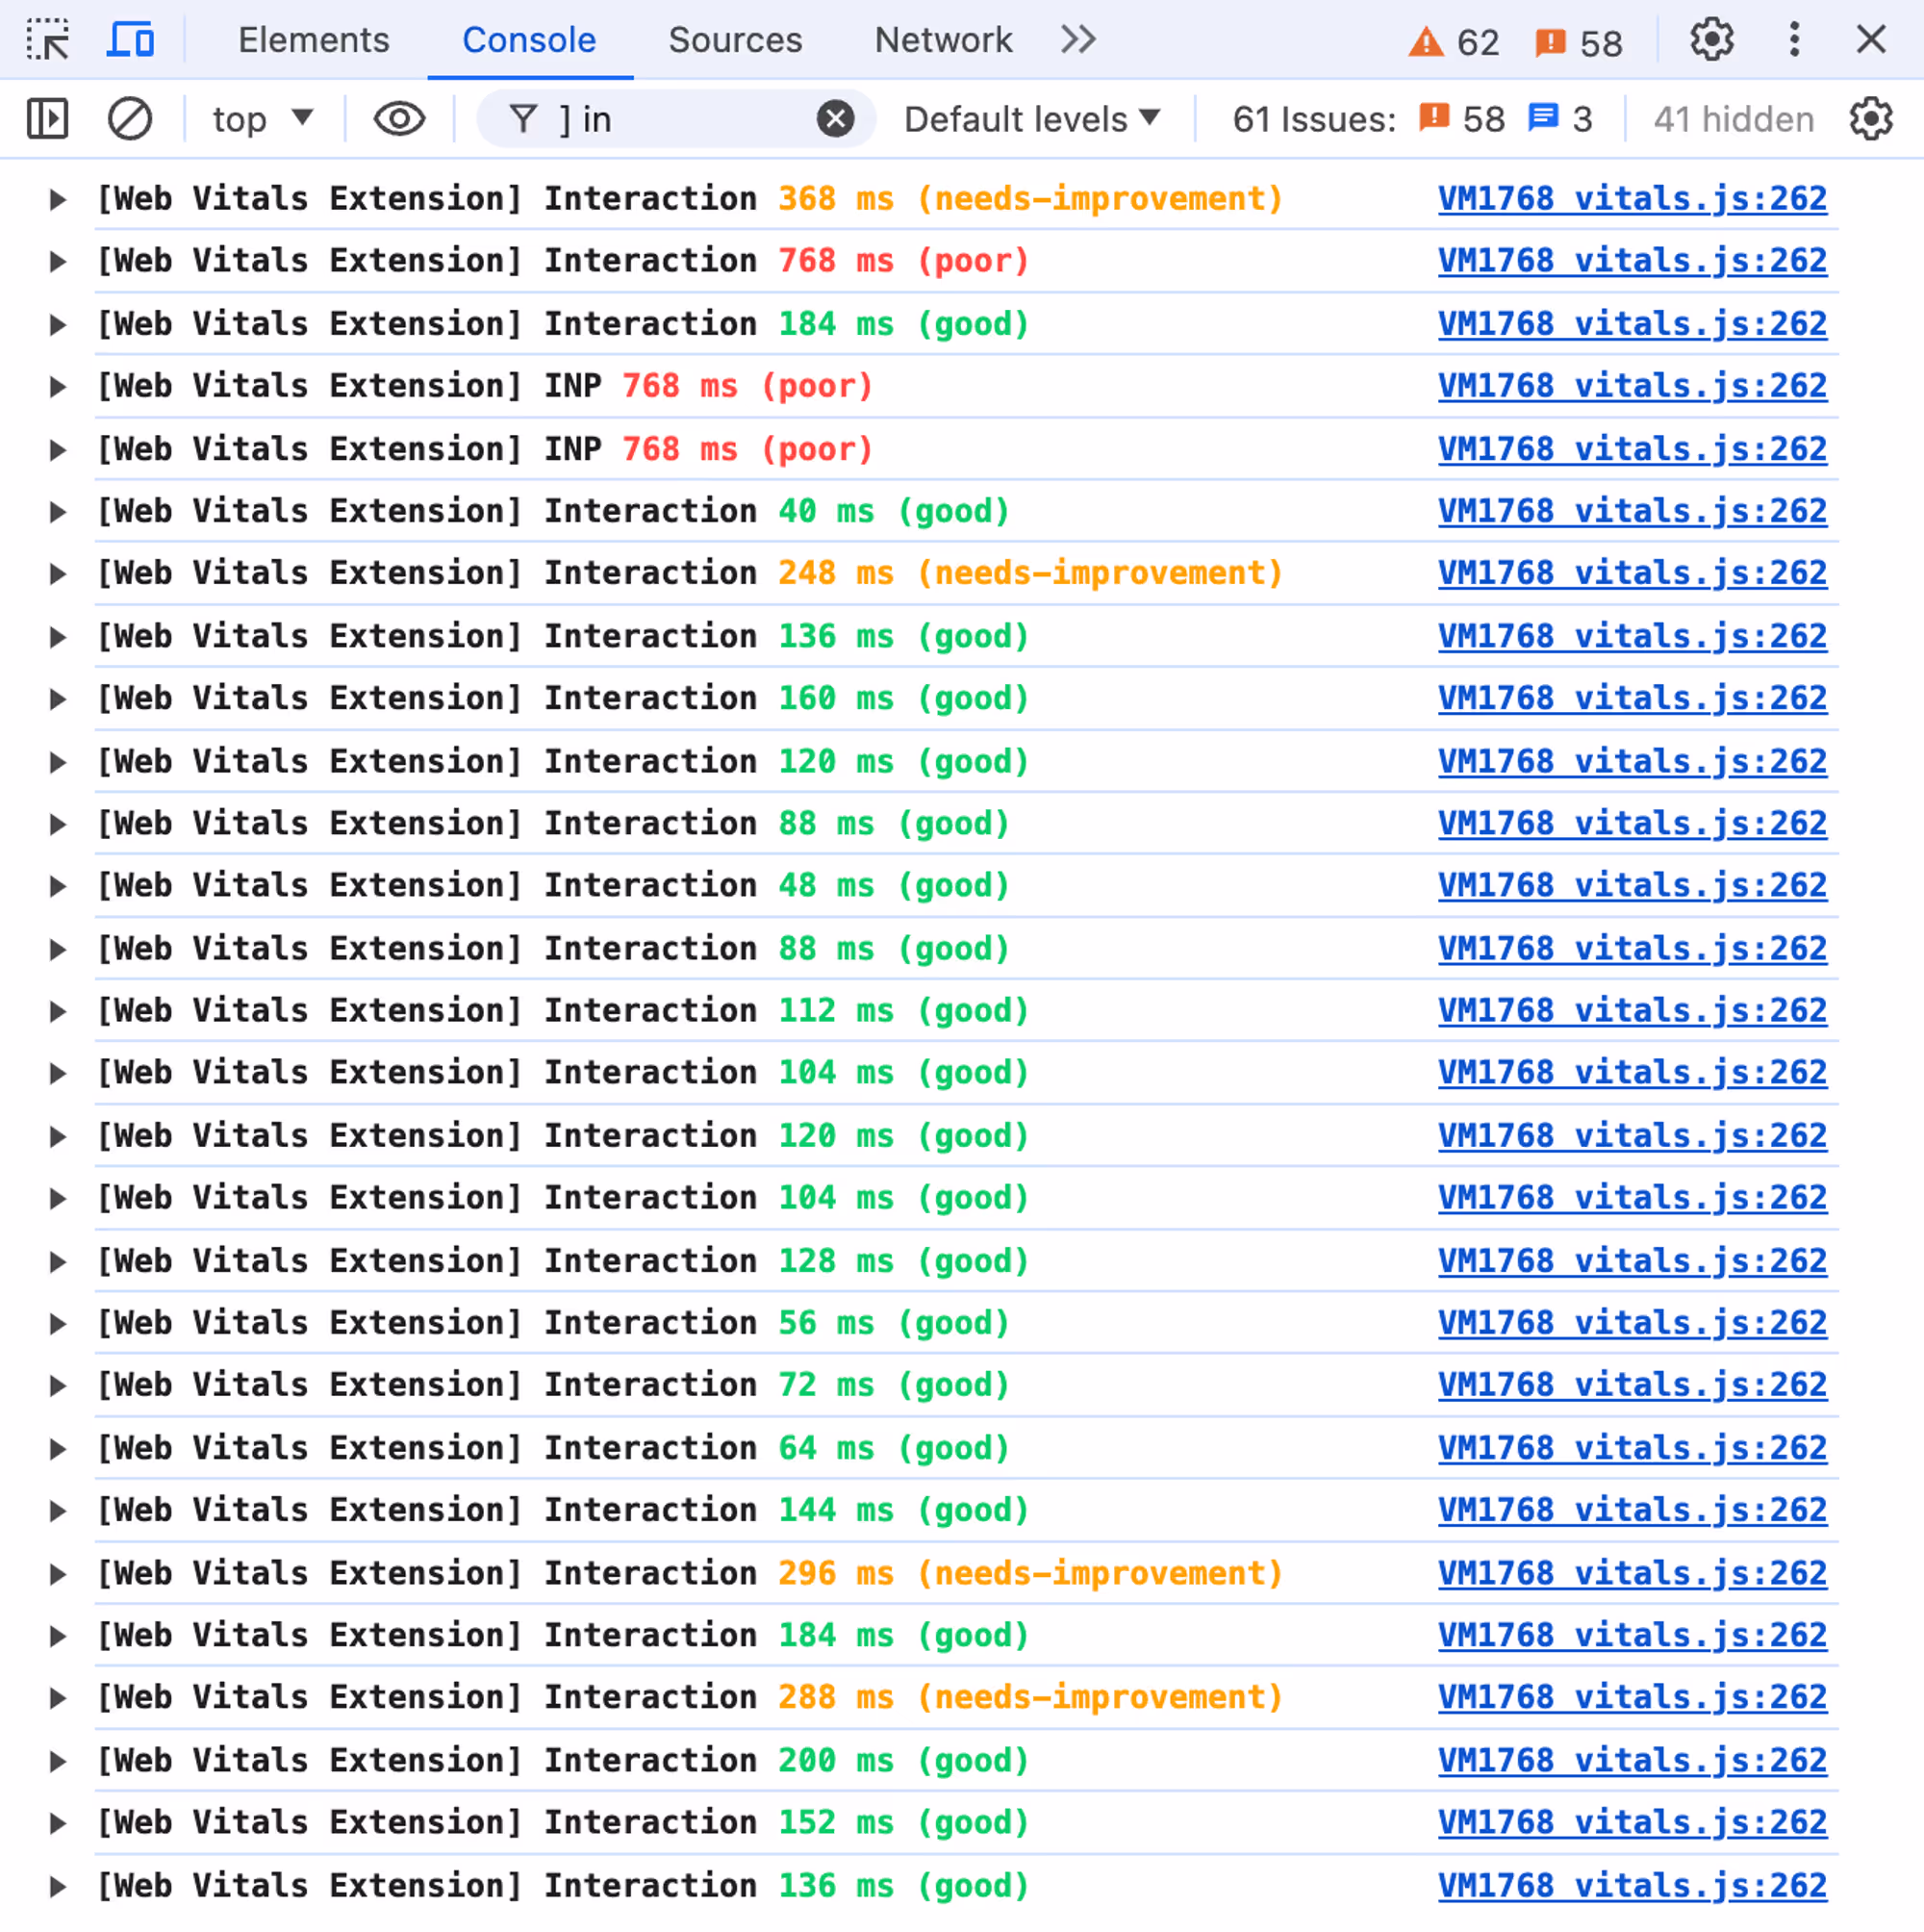
- Interact with the page: This is the trickiest part. You will have to click/tap and type everywhere you can think of, in order to measure the Interaction to Next Paint of every interaction. While you interact, watch the logs in the console. We suggest filtering the console messages by "] in", so you can eliminate the noise and focus on the logs you’re looking for: INP and Interaction.
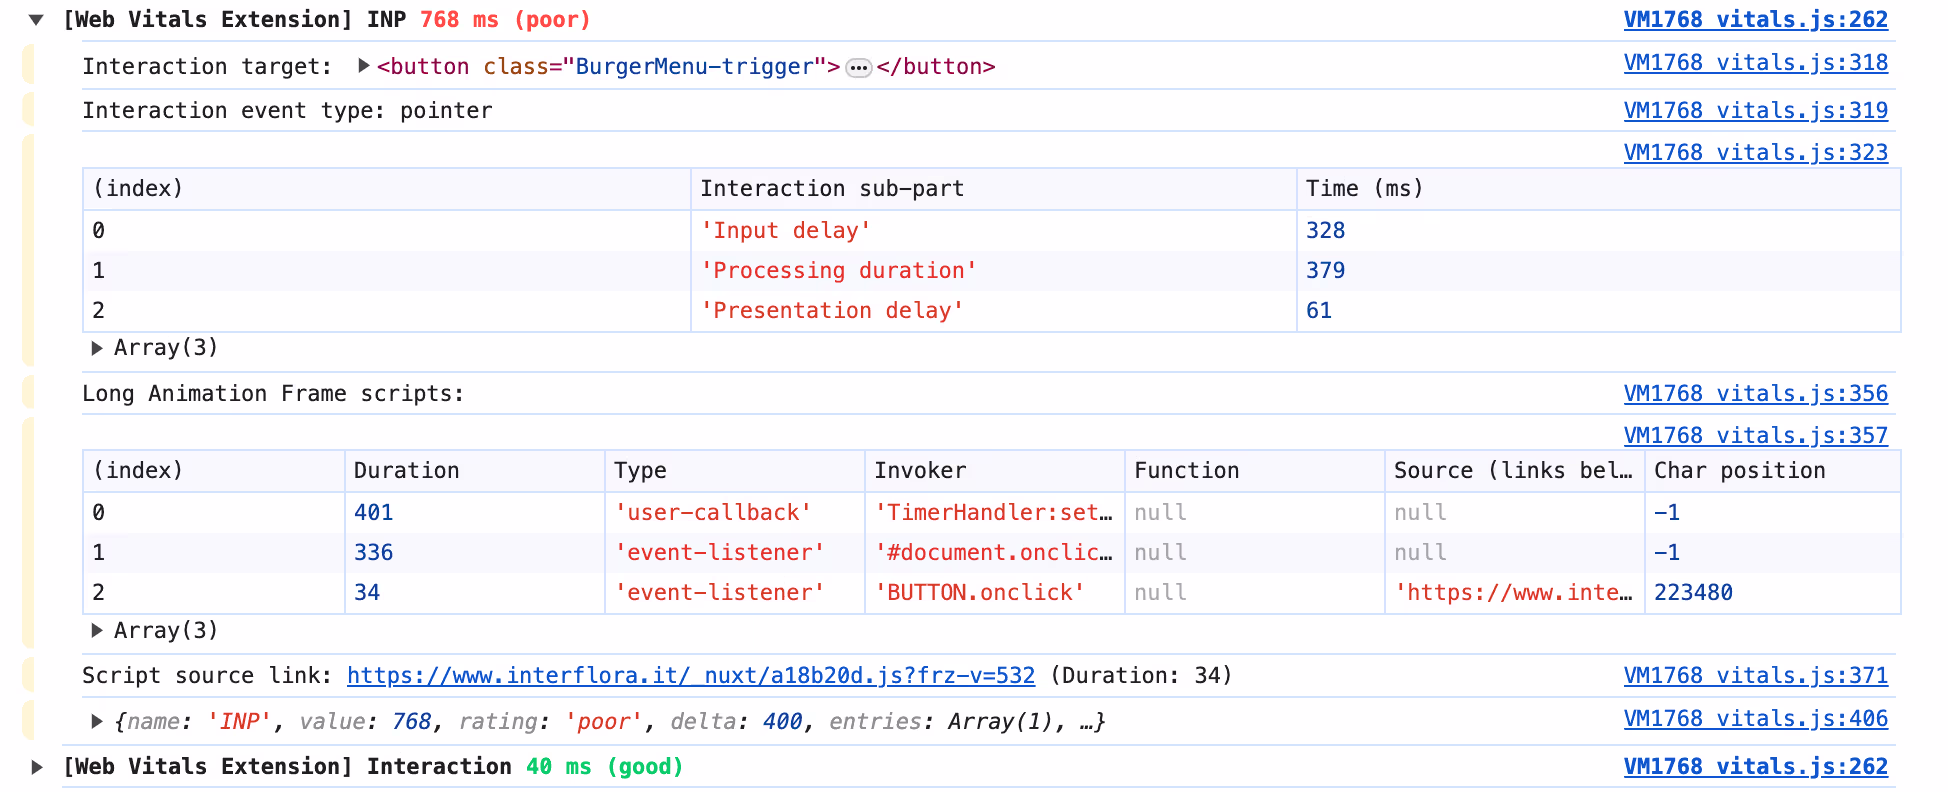
- Get more detailed information on the slowest interaction by expanding one of the items logged as INP. In the details, you can find the interaction sub-parts (input delay, processing duration, presentation delay) and the source of the slow interaction in the Long Animation Frames scripts section.
- Interact with multiple elements on the page and monitor the console logs produced by the Web Vitals extension for Chrome to find the slowest interaction.
- Repeat the steps above for each page type, e.g., home page, product listing pages (PLP), product detail pages (PDP), etc.
How to find slow interactions using RUM data
When armed with RUM and INP attribution data, you can easily identify where the slowest interactions are occurring, so there’s no need to manually debug each page type. The following screenshot shows the result of a query run against the RUM data collected using Speed Kit on one of our client websites.
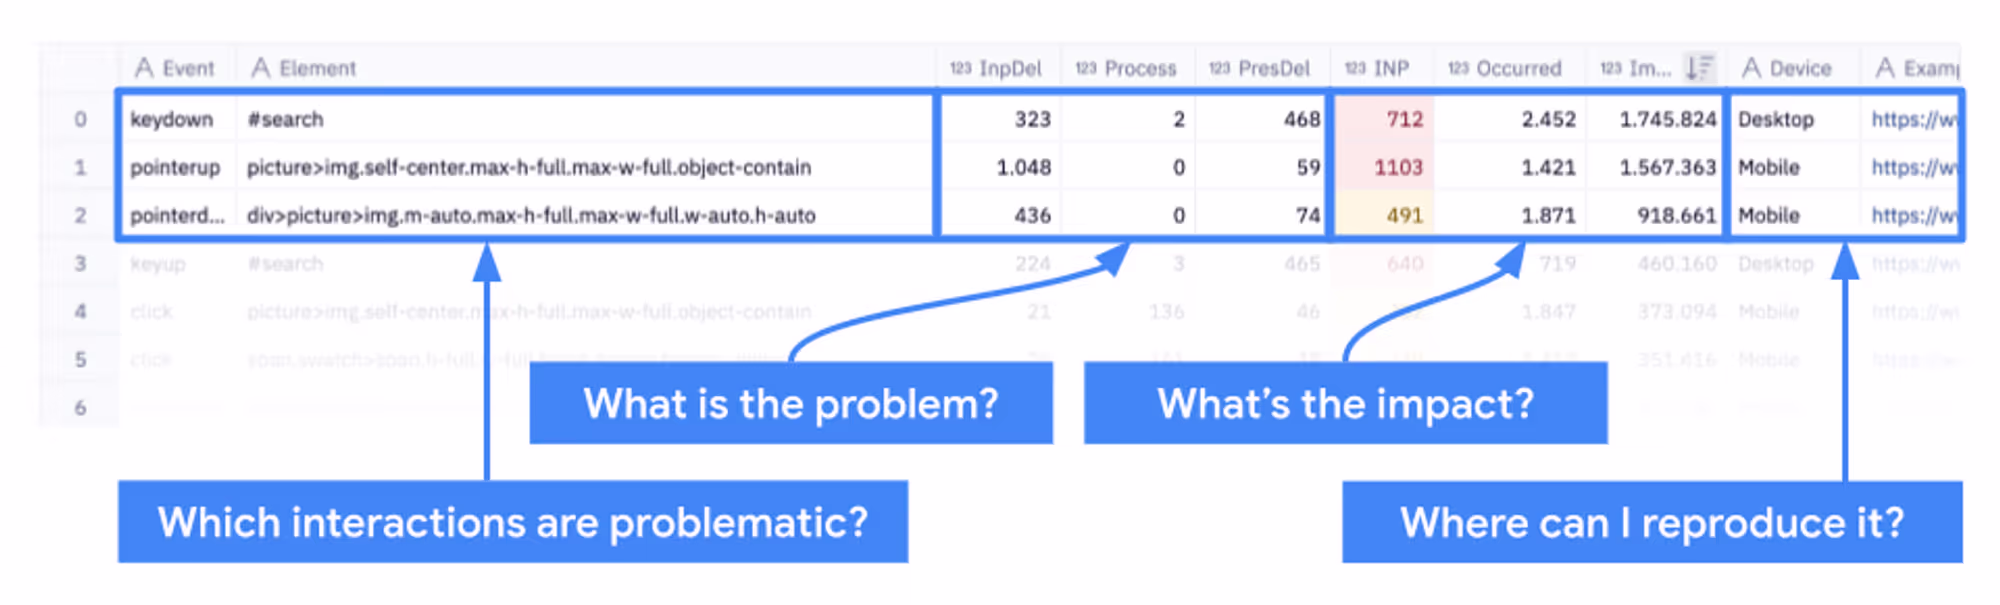
From RUM data you can get a precise list of the most problematic interactions. And for each interaction, more specifically, the following data to answer specific questions.
Which interactions are problematic?
- Event: the event type (e.g.
keydown,pointerup,pointerdown) - Element: the CSS selector of the element triggering the interaction
What is the problem?
Check the sub-part which takes the most time:
- Input delay: the problem is not this event, look at what happens before it
- Processing time: the problem is in the event handlers attached to this event
- Presentation delay: the problem is in the consequences of this event to style and layout, rather than in the JavaScript event handler
What is the impact?
- INP: the value of the INP generated by this specific interaction (at the 75th percentile)
- Occurred: the number of times this specific interaction occurred in the selected time frame
- Impact: the multiplication of INP and Occurred. This value tells us the impact of this interaction, as we don’t want to neither focus on the most recurring ones (which can have a good value) nor on the worst ones (which can have occurred a few times). So we sort the whole query by this field descending.
Where can we reproduce it?
- Device: the device type this interaction occurred in. If it occurred on more than one device type, this row will be duplicated, so it will have the same Event and Element, but different Impact.
- Example URL: an arbitrary URL where this slow interaction was found.
2. Analyze the causes of slow interactions
The best way to start debugging a slow interaction that you found in the previous step is to reproduce it while running a performance trace, e.g. in Chrome Dev Tools.
To do so, open developer tools, emulate mobile device, slow down CPU speed (for details, see the steps in the previous chapter).
- Activate the Performance Panel in Chrome Developer Tools.
- Start recording. This will allow you to trace the long-running tasks and the causes of bad responsiveness.
- Perform the slowest interactions. You know what they are, either because you spotted it using the Web Vitals extension, or because you have RUM data telling you what’s the slowest interaction.
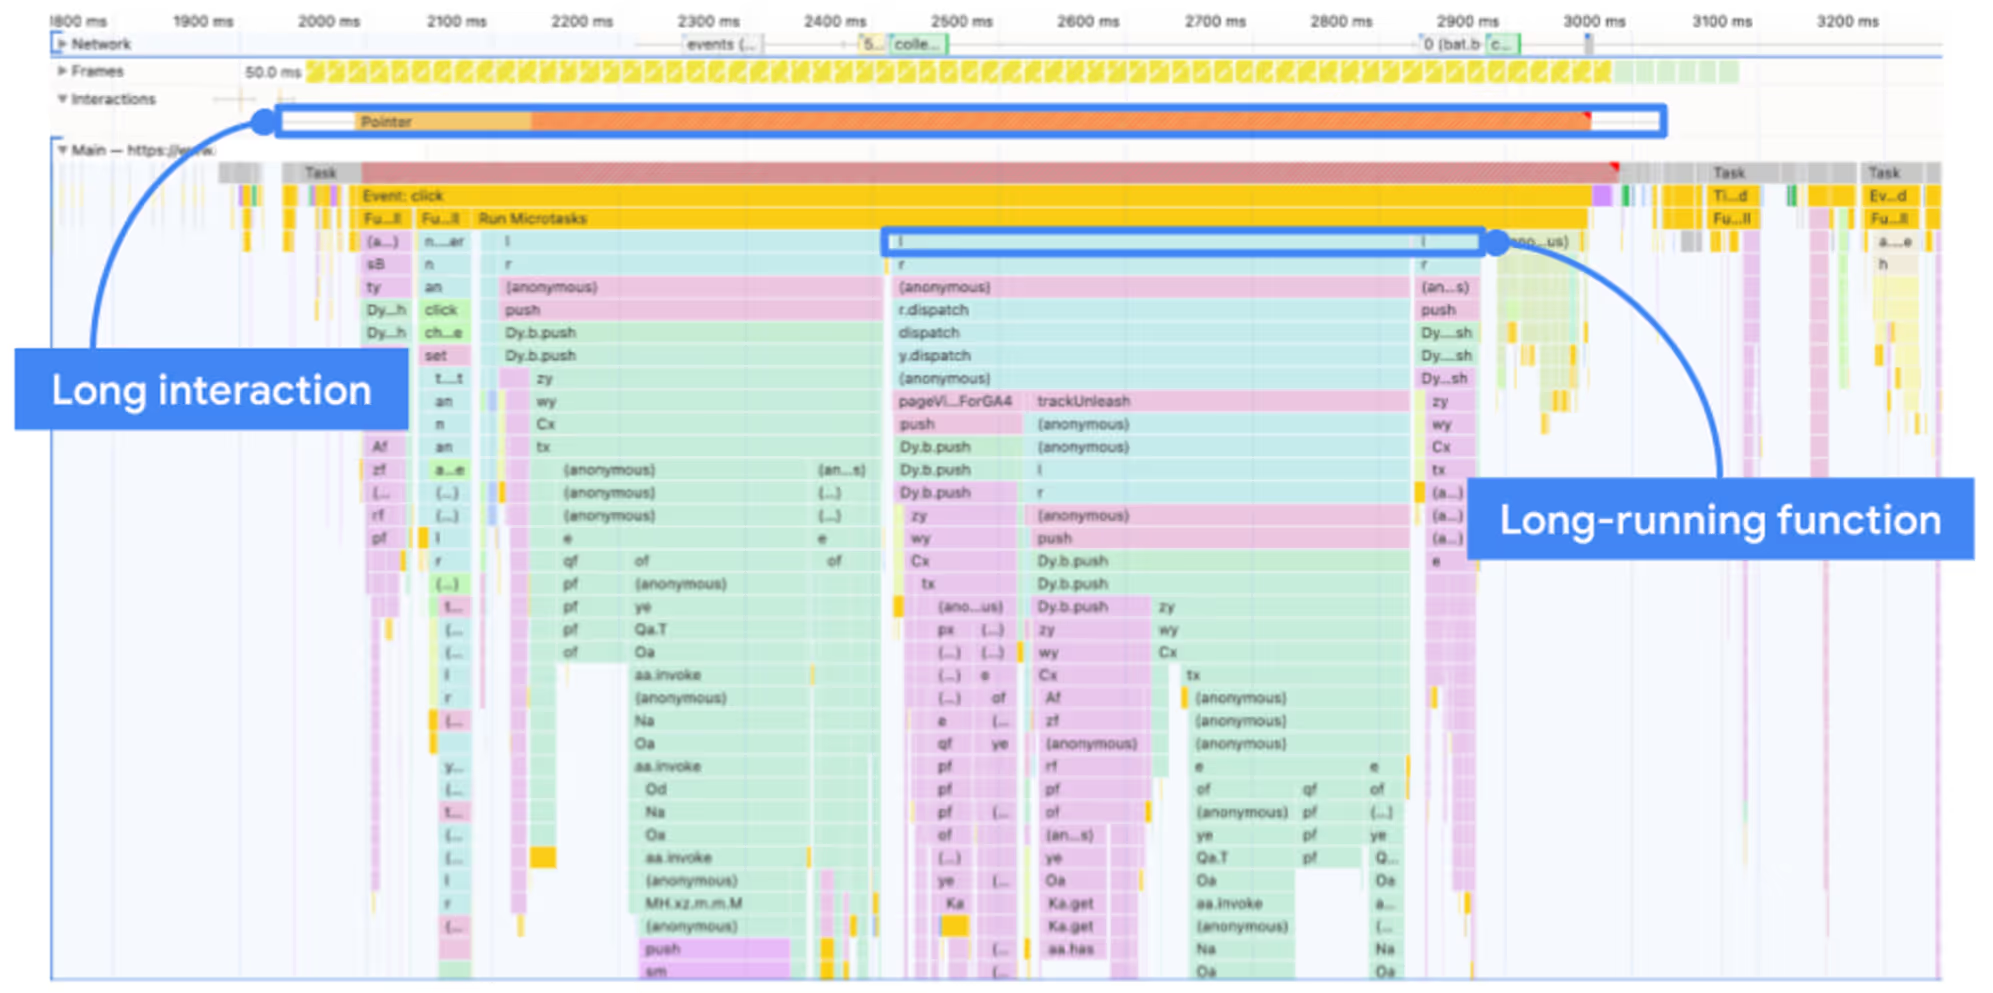
- Stop recording. Hit the record button in the Performance Panel again to stop the recording. Once stopped, the Performance Panel will show a flame chart, similar to the following.
- Analyze the interactions in the Interactions swim lane of the recording. Interactions longer than 200 ms will be highlighted. For more information click here.
Common mistakes to avoid
Synchronously sending analytics beacons
The most common issue we discovered while auditing online stores is related to sending analytics data synchronously, without leaving to the browser the time to yield to the main thread.
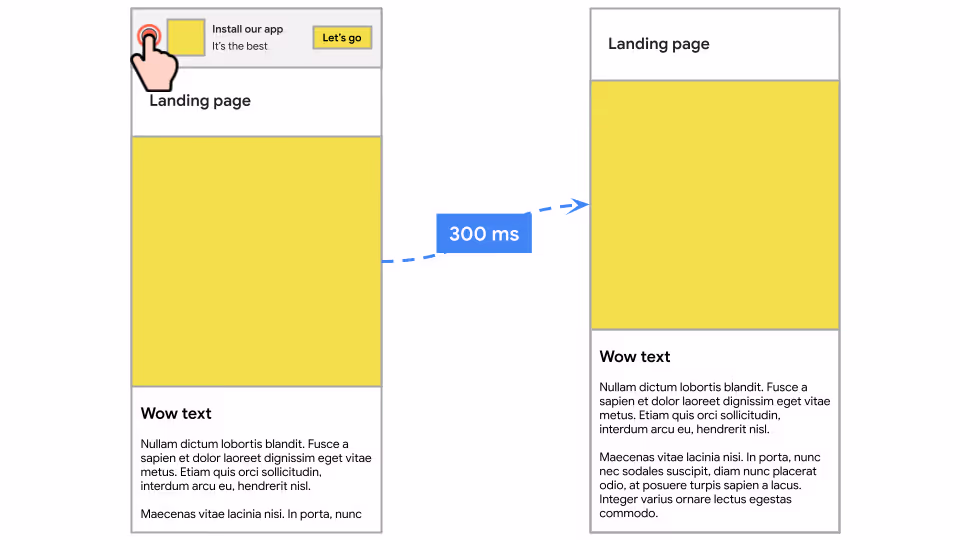
Example: a size selector on the product page sends data to analytics when a size is selected. The result is that when a user clicks on a size, it takes a whopping 1100 ms just to update the style indicating the clicked size was selected. Let's dive into why this happens and how we can fix it.
Problem
When a user selects a size, the website was sending data to an analytics service. While collecting data for analytics is essential for understanding user behavior and optimizing the store, the implementation had a significant drawback: the function call to send data was made synchronously.
To say it with pseudo code, the code to handle the select size was something like this:
function selectSizeHandler() {
  selectSize();
  pushToTagManager();
}
Here selectSizeHandler is executed in a single task, which blocks the main thread until it has finished executing, causing a delay in the rendering of the page.
Solution
To enhance performance and provide a smoother user experience, ensure that any non-essential operations, like sending data to analytics, do not block the main thread.
Using the pseudo code from the problem section, you can change it to an async function and await a function call to yieldToMain.
async function selectSizeHandler() {
   selectSize();
   await yieldToMain();
   pushToTagManager();
}
☝️ New version of selectSizeHandler which selects the size then yields to the main thread before pushing data to analytics.
function yieldToMain() {
   if ("scheduler" in window && "yield" in scheduler) {
      return scheduler.yield();
   }
   return new Promise((resolve) => {
      setTimeout(resolve, 0);
   });
}
☝️ The yieldToMain function returns a promise which resolves with a setTimeout of 0 seconds.
As a result, the pointer event now takes way less time, returns the control to the main thread of the browser, which can now paint something in the UI, then it sends data to analytics in a low-priority fashion.
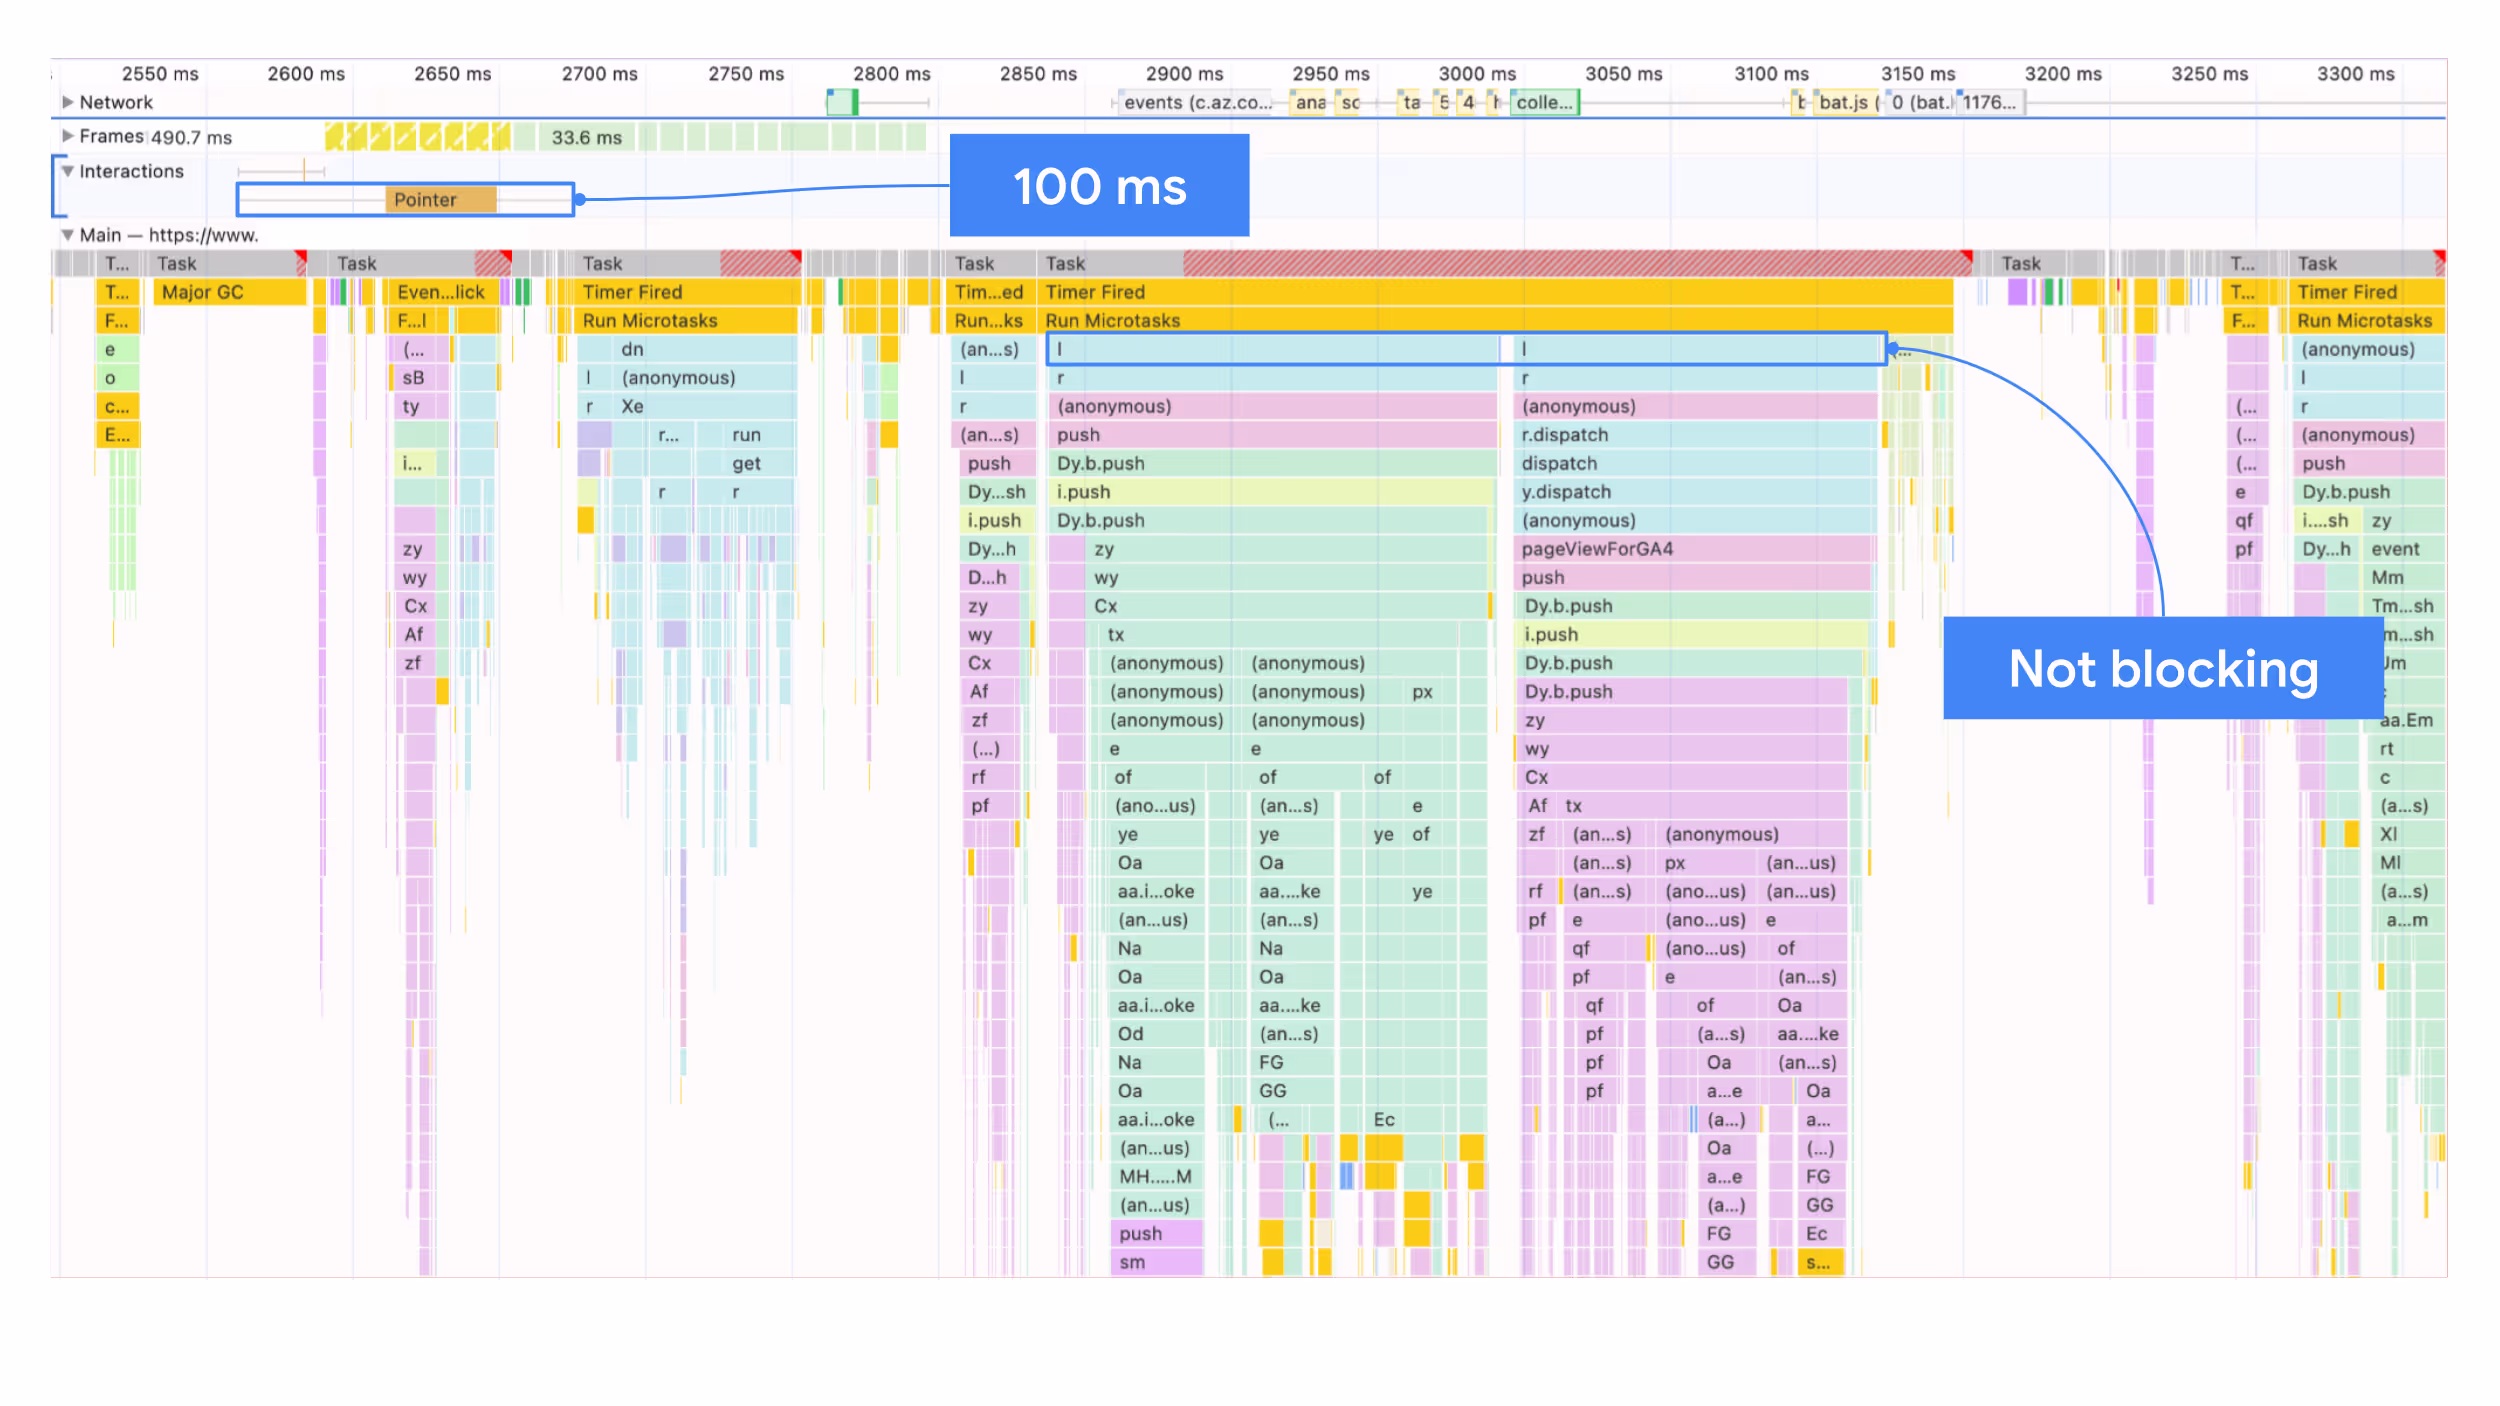
The flame chart of the action recorded in the Performance panel of Chrome Dev Tools, showing the much shorter pointer event, and the function l executed after the user interaction.
Inducing style recalculation
Another issue that can severely impact user experience is style recalculation. This is when something induces the browser to recalculate the style of a web page, which in turn causes delays in rendering updates.
One of the cases we found is this website showing a banner in the topmost part of the page. We found it weird that just a shift up of the website layout could generate such a huge Interaction to Next Paint value, so we decided to investigate further.
Problem
As you can see from the following flame chart, the presentation delay part is by the vast majority composed by a style recalculation task.
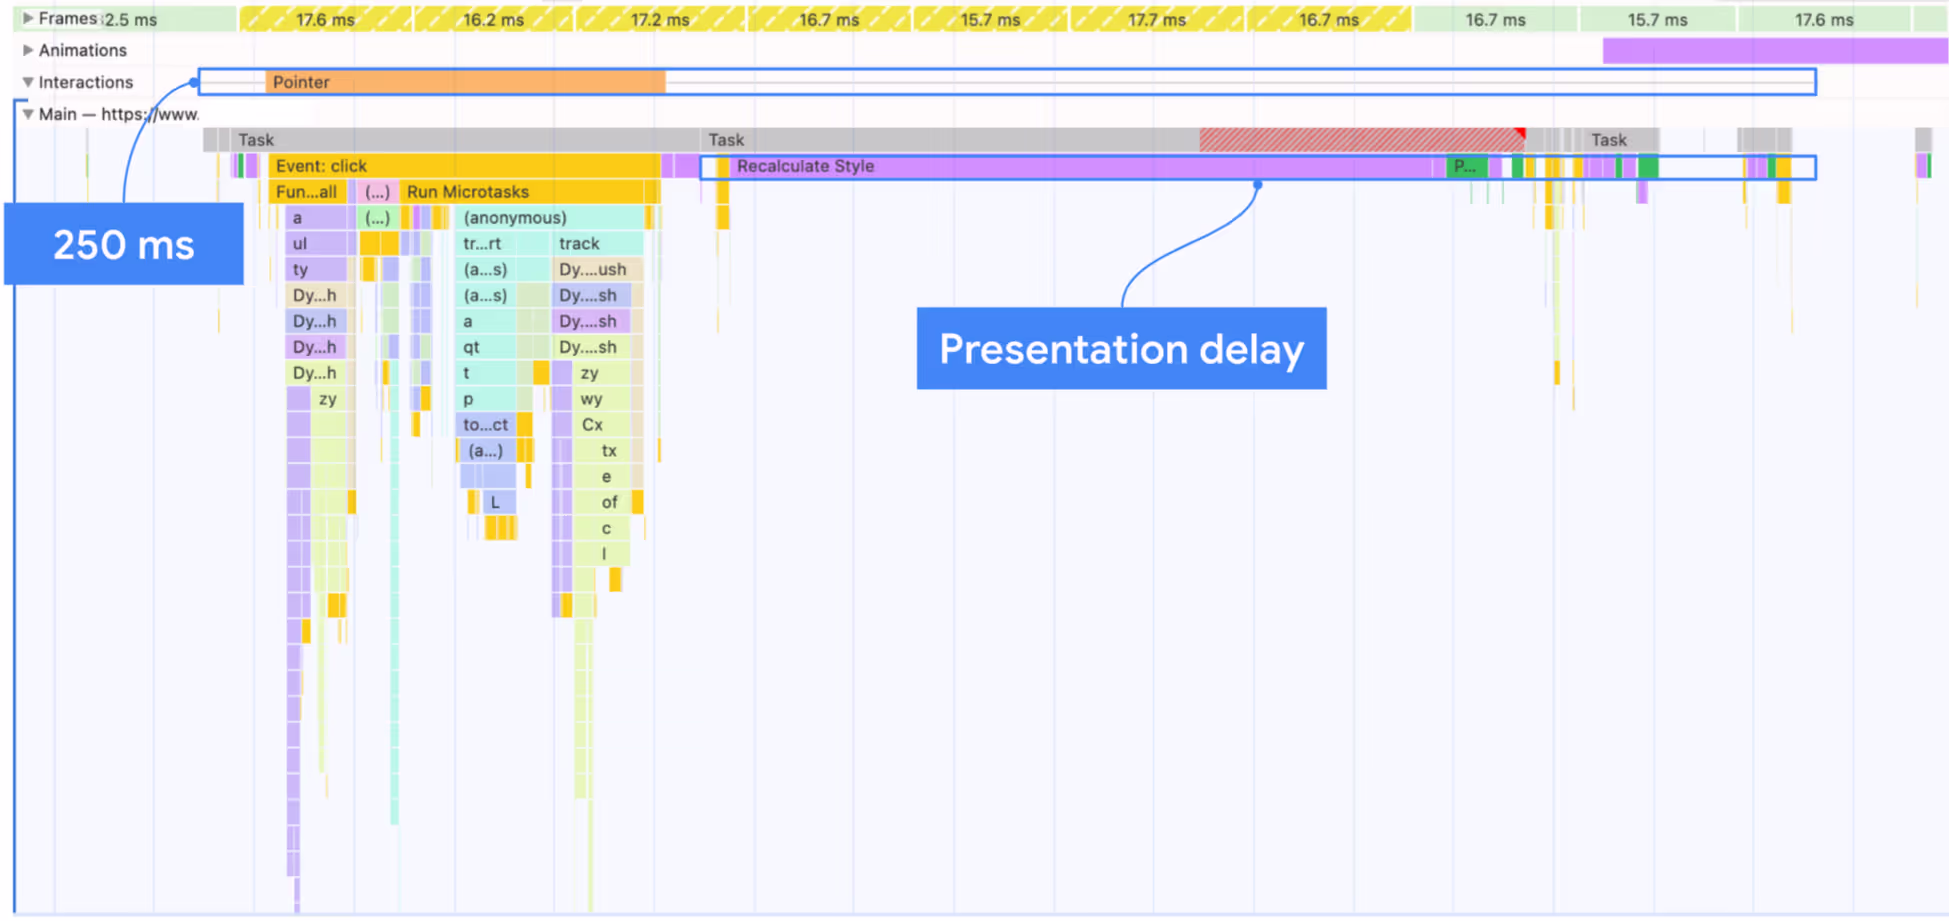
After digging into the code a bit, we realized that the long Recalculate Style task was triggered by CSS custom properties (aka variables) being set on the body tag. See this Chromium issue (not a bug).
<body
  class="..."
  style="--app-header-height: 223px; --app-header-offset-top: 223px"
>
Solution
One way to reduce the style recalculation effort could be to assign one or more modifier classes to the body element, instead of assigning it CSS custom properties. But this is not always possible, e.g. when the custom properties values are continuously computed via JavaScript depending on multiple factors.
If that’s the case, here are the possible fixes:
- If the custom properties are used in CSS at a lower level of the DOM, assign it closer to the DOM element where they are used, instead of to the
bodyelement - If the custom properties are used in CSS at a high level of the DOM and only by the parent element (they don’t need to be inherited by the children), register the custom property as not inheritable using the static method
CSS.registerProperty(). More info in this comment to the Chromium issue. - If the CSS custom properties are used only in JavaScript, there is no point in making them CSS custom properties: just leave them in the JavaScript scope.
Since, in our case, the custom properties were not used in CSS, we ran a test using local overrides in Chrome Dev Tools and removed the assignment of the custom properties to the body element.
This is the result:
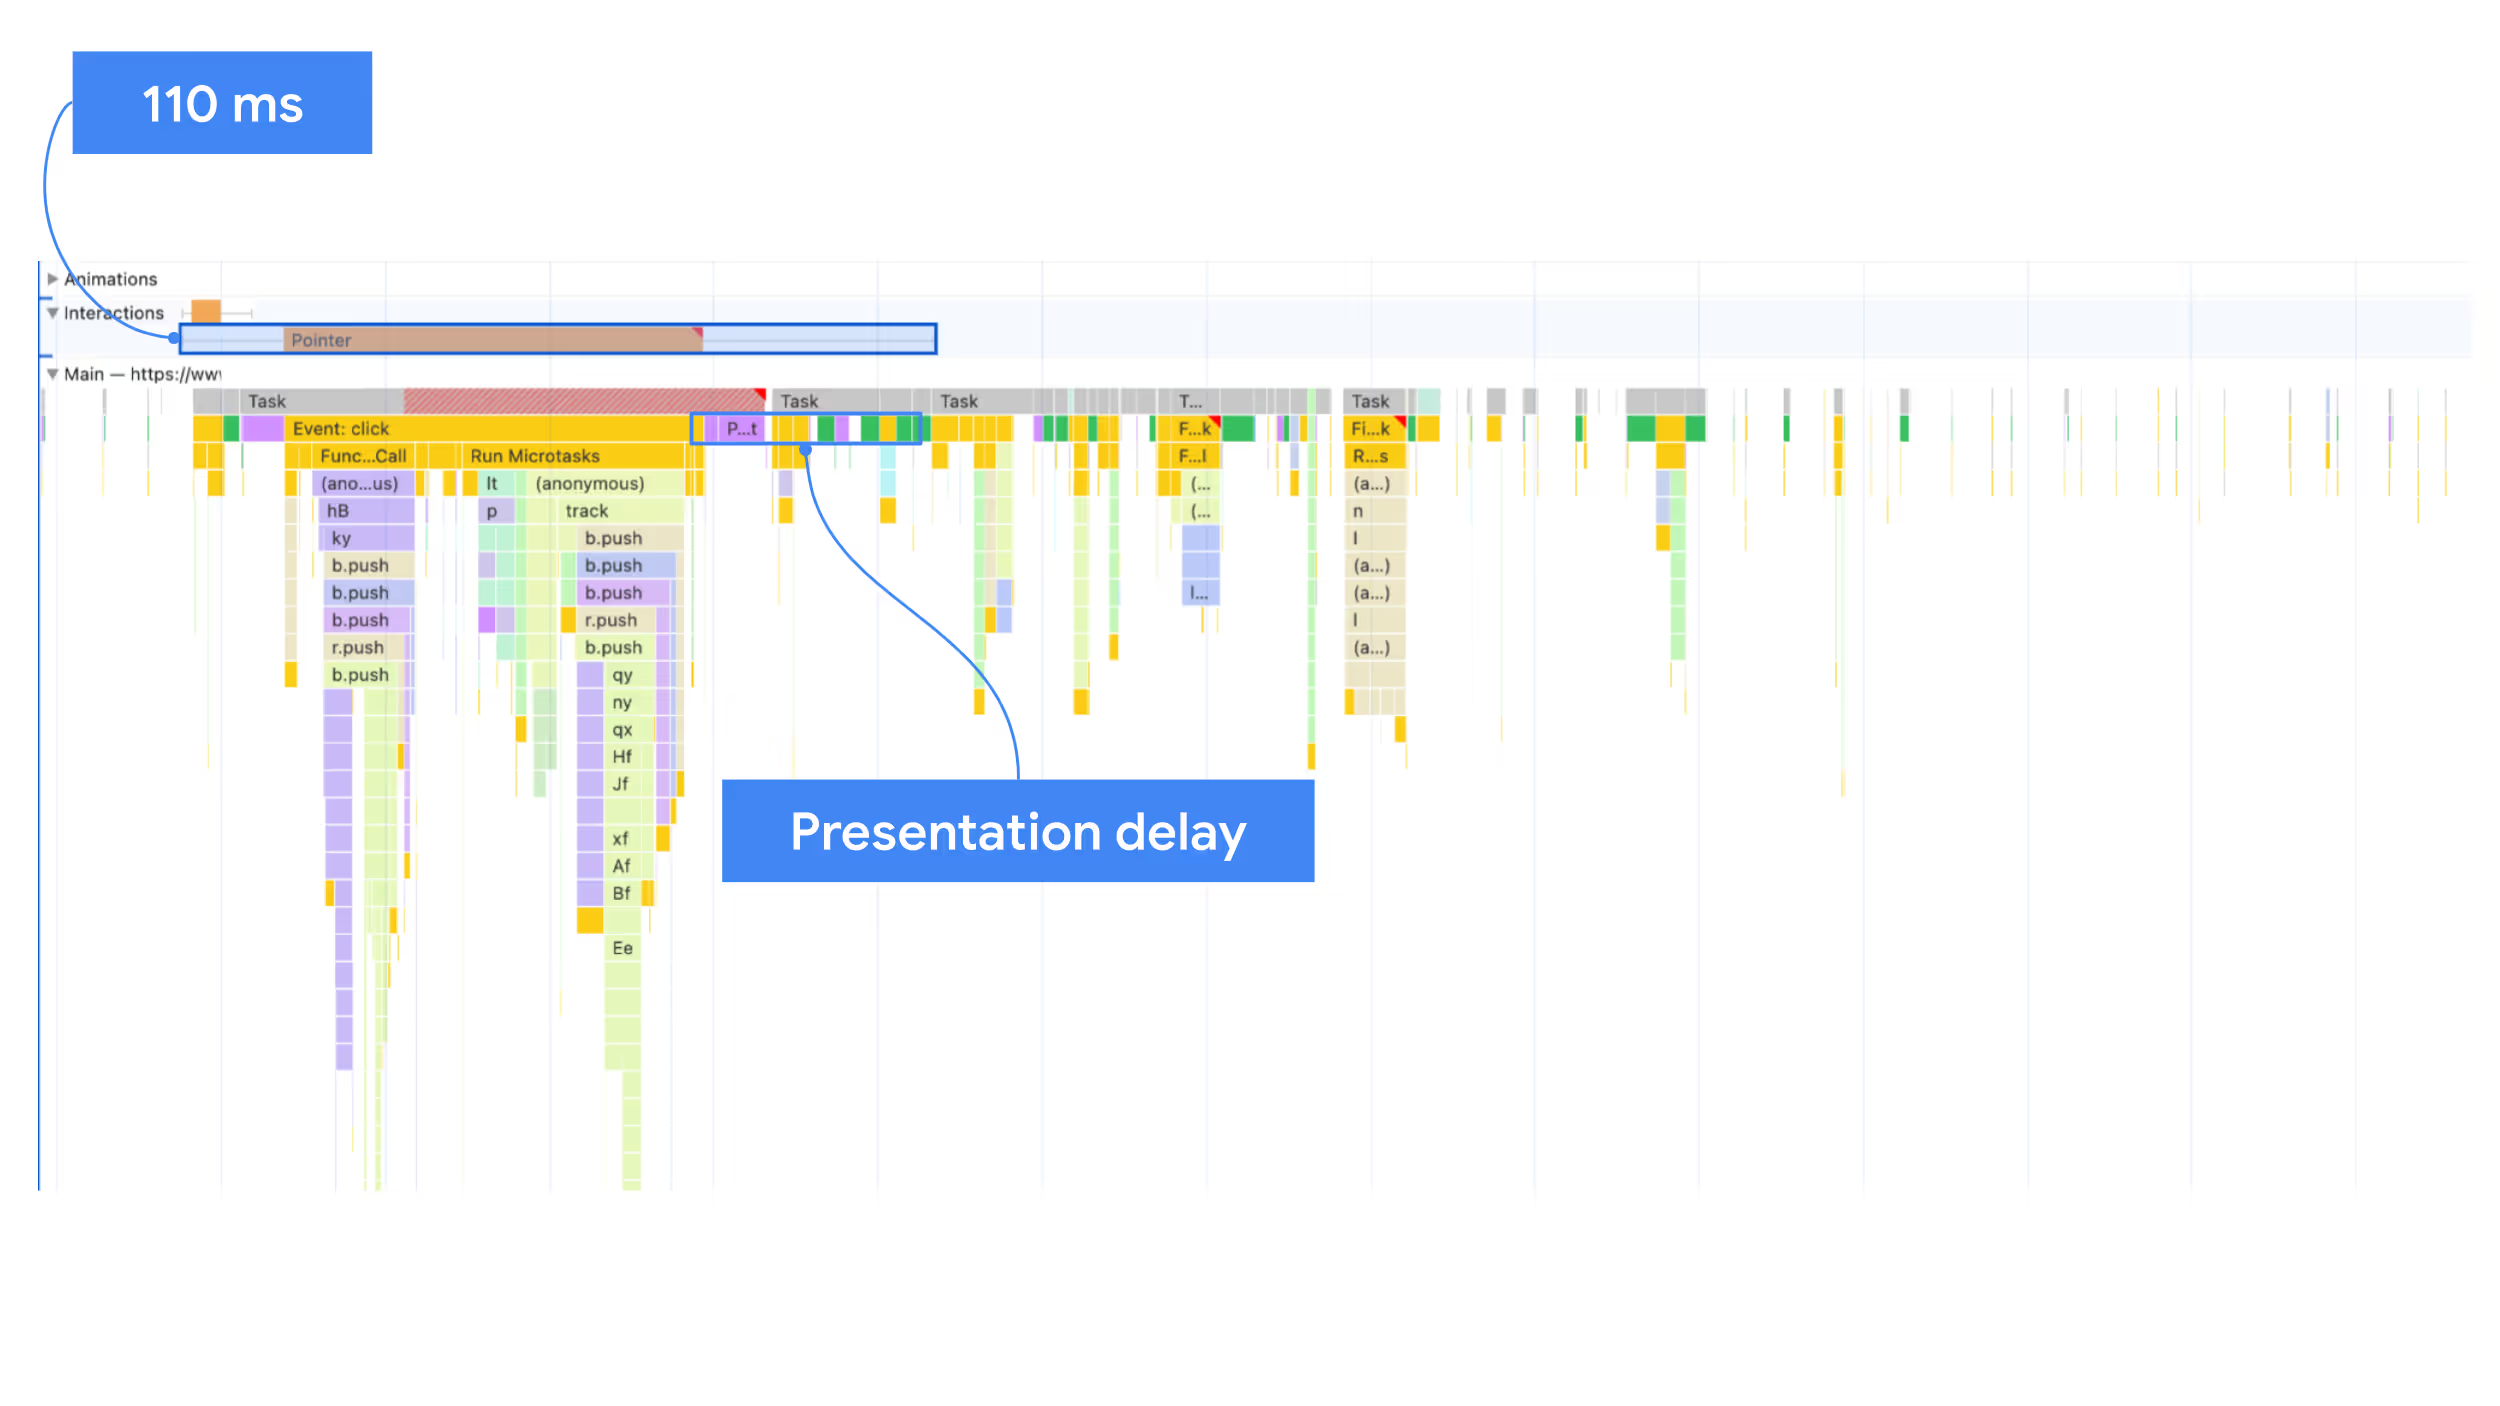
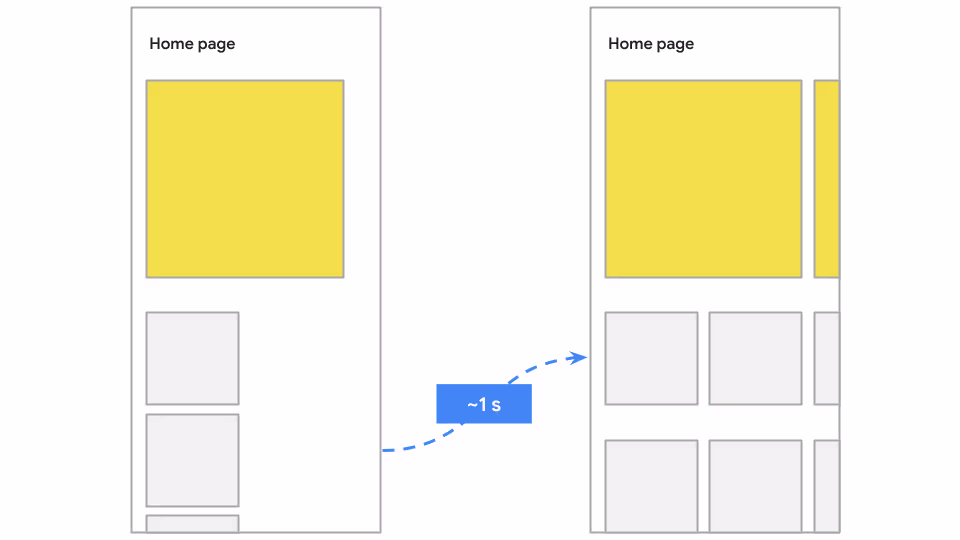
Executing too much UI-related JavaScript at once
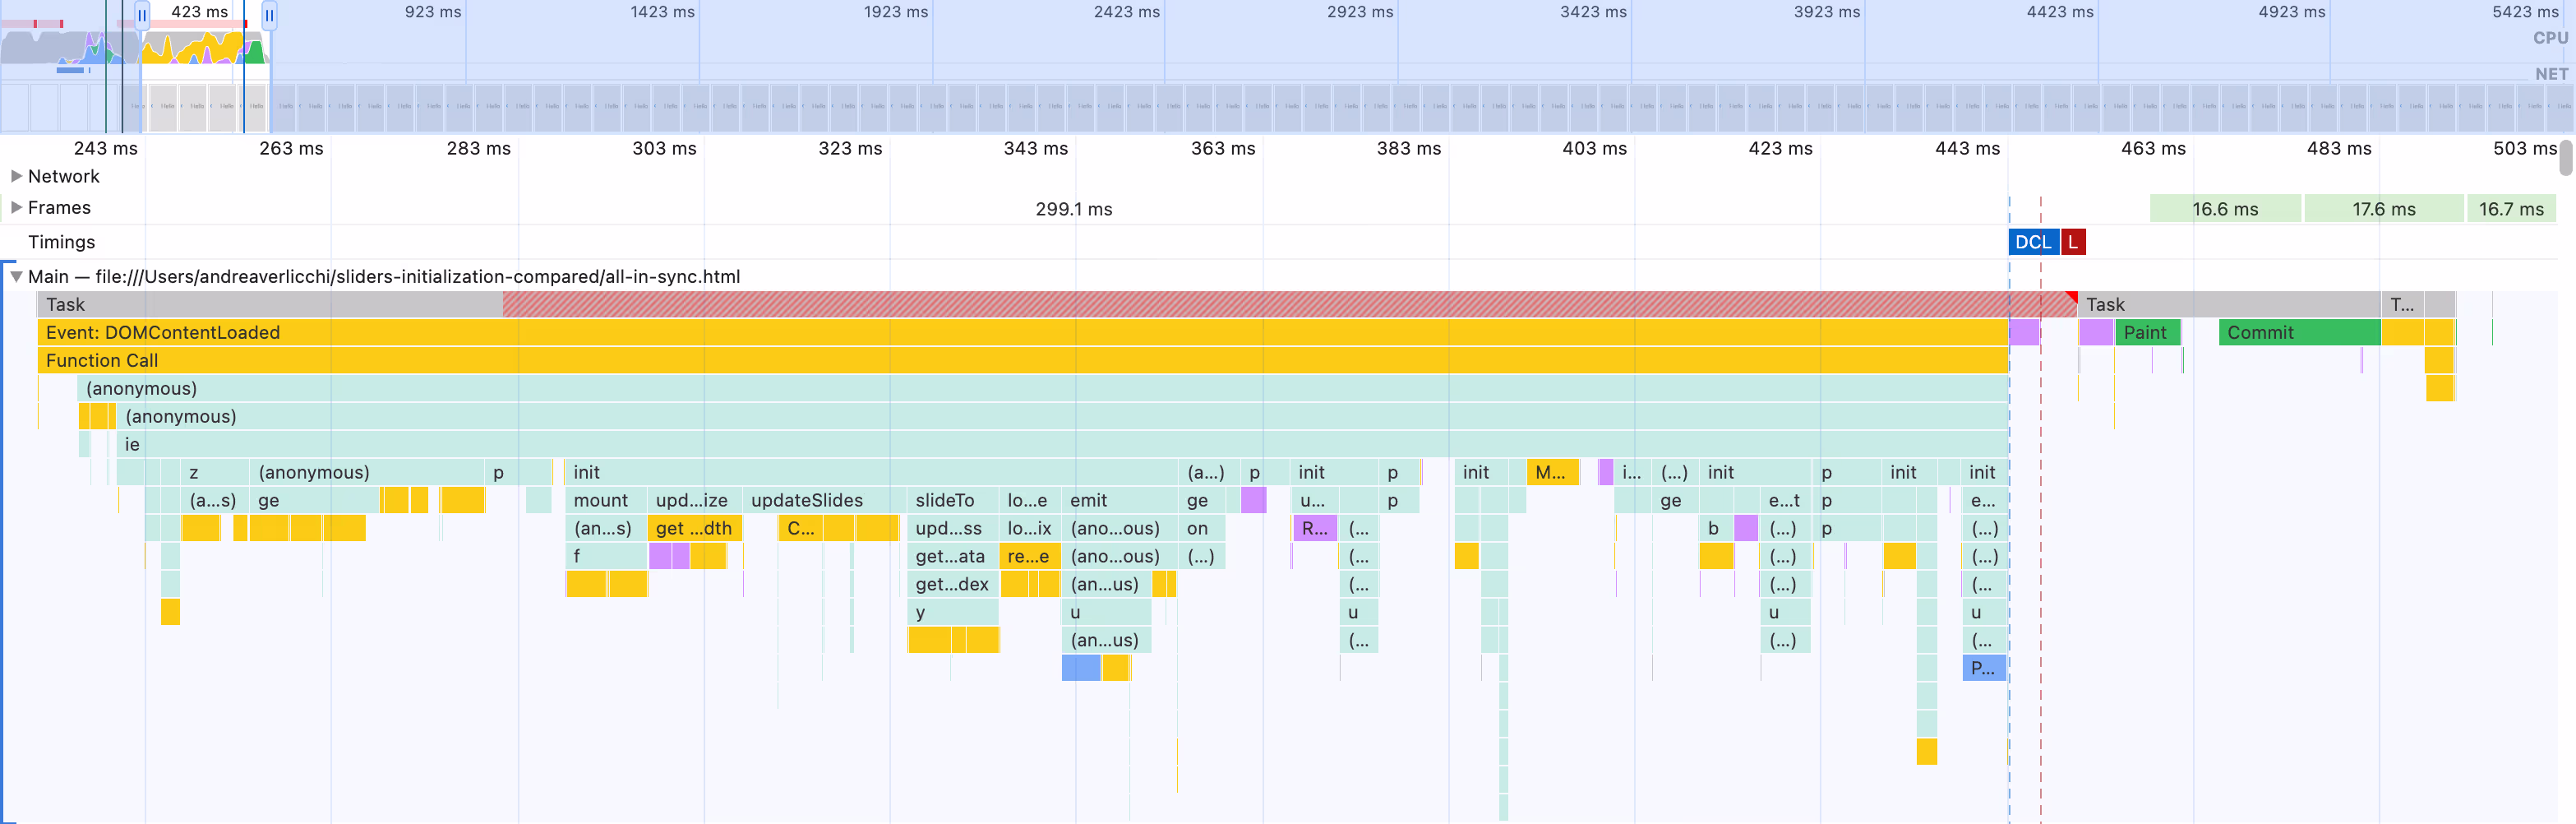
In a website we audited, we found the code to initialize seven sliders at once, no matter if they were immediately visible to users. That caused a long task preventing the page to render for hundreds of milliseconds, which resulted in both in a very bad user experience and in a very high Interaction to Next Paint.
Problem
Too much JavaScript code executed to initialize the UI, such as sliders, might generate long tasks which don’t yield to the main thread, blocking the website responsiveness. To showcase that, we created a test page where I’m initializing seven sliders at once, replicating what we found during our audit. As you can see from the screenshot below, this generates a long task of more than 200 ms.
Solution
The mantra of optimizing INP is to break up long tasks and avoid executing too much JavaScript at once, so here’s what we did:
- Initialize only the sliders that are relevant to users, instead of initializing all of the sliders
- Yield to the main thread before initializing each slider, to avoid blocking the main thread
Here’s the code we used to initialize sliders only when they enter the viewport, yielding control back to the main thread before initializing each one.
// Select all slider elements
const sliders = document.querySelectorAll('.my-slider');

// Async function to initialize a slider
const initializeSlider = async (slider) => {
  if (slider && !slider.classList.contains('slider-initialized')) {
    // Yield to the main thread
    await yieldToMain();

    // Initialize your slider here, for example using Swiper
    new Swiper(slider, { /* Options */ });
    // Add a class to ensure the slider is not initialized again
    slider.classList.add('slider-initialized');
  }
};

// Create an IntersectionObserver
const observer = new IntersectionObserver((entries, observer) => {
  entries.forEach(entry => {
    if (entry.isIntersecting) {
      // Initialize the slider when it enters the viewport
      initializeSlider(entry.target).then(() => {
        // Stop observing after initialization
        observer.unobserve(entry.target);
      }).catch(console.error);
    }
  });
});

// Start observing each slider element
sliders.forEach(slider => {
  observer.observe(slider);
});
With the optimization in place, the main thread has visibly much less work to do:
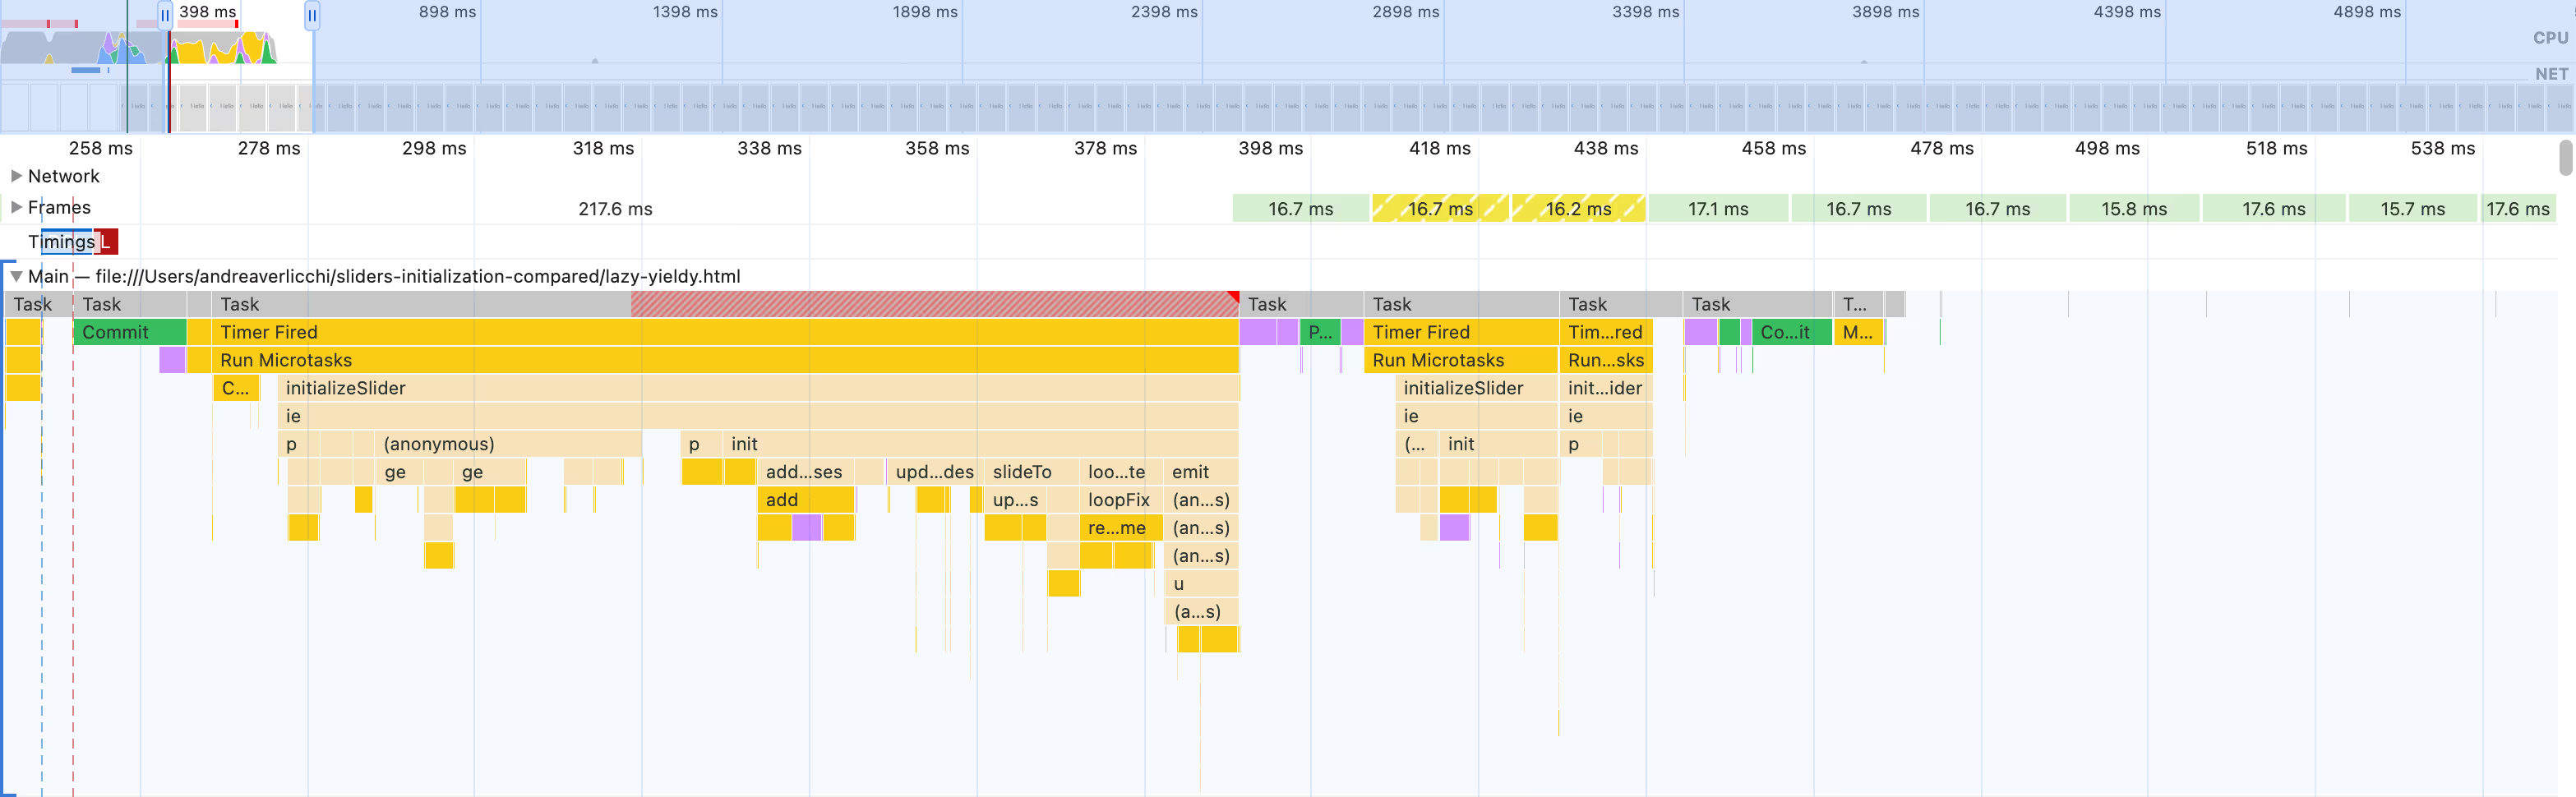
Breaking up code into multiple functions, and executing the functions only when required, improves the user experience (UX) and results in a much smaller INP.
Alternative solution
An even better way to reduce INP is to remove JavaScript code that isn’t necessary. The question is: do we need JavaScript to create sliders? It depends on how advanced its functionalities need to be, but if you only need a) content that automatically scrolls horizontally, and b) dots to highlight the current slide, you can probably make a slider using CSS code only: see scroll-snap-type on MDN.
Wrapping up
Here is a summary of key points covered in this blog post:
- Understanding INP: INP measures the time from a user's interaction with a webpage until the next visual update. It includes input delay, processing time, and presentation delay.
- Finding Slow Interactions:
- Without RUM Data: Use tools like the Web Vitals extension and Chrome Developer Tools to manually identify and debug slow interactions.
- With RUM Data: Utilize Real User Monitoring (RUM) data to pinpoint specific interactions causing delays, making the debugging process faster and more precise.
- Debugging Slow Interactions:
- Reproduce slow interactions while running a performance trace in Chrome Dev Tools.
- Analyze the resulting flame charts to identify long-running tasks and optimize them.
- Avoiding Common Mistakes:
- Synchronously Sending Analytics Beacons: Ensure non-essential operations do not block the main thread by using asynchronous functions and yielding to the main thread.
- Inducing Style Recalculation: Minimize style recalculations by assigning CSS properties closer to the DOM elements where they are used.
- Executing Too Much UI-Related JavaScript at Once: Break up long tasks and only initialize necessary UI components to avoid blocking the main thread.
By following these steps and avoiding common pitfalls, you can significantly improve your website's INP and provide a better user experience. Regular monitoring and optimization are key to maintaining high performance.
Resources
For more information and detailed guidance, refer to these resources:
- How to Optimize INP on web.dev
- YouTube Videos on INP Optimization, Interactive Performance, and Web Vitals.
A big thanks goes out to Brian Louis Ramirez for reviewing this post!


